by Mark Biever, L.G., L.E.G.
Environmental Monitoring Program Supervisor for Thurston County
Summer Outlook
Here we are again already in the middle of Summer and things are heating up for the Northwest. Looking at the medium range forecast (30 – 60 days) for our area of the Puget Sound, we are shaping up to be on the dry side. It is becoming more common in the past ten years that our summers are getting hotter, drier and longer. This is what the climate models have predicted for our area and it seems to be following the script closely. The summer of 2018 is predicted to be warmer than average and very dry, in fact, we are predicted to be in the drought territory by the end of July. At this point it does not appear to be as severe as the 2015 drought, but it is well under way and we won’t know its extent until fall. Even the 4th of July was rain free.
This has become much more common in the last decade than in the previous 30 years. If you have lived here for more than 20 years you will understand what I mean. It used to be common knowledge that summer always started on the 5th of July, because the 4th was usually “see your breath cold” and rainy.
Current Stats
Since May 1, 2018, we have had only 1.6 inches of rainfall, making it one of the driest Mays on record (with just under a half an inch of rain in Olympia – the average is 2.65 inches).
June was more than an inch below normal as well. We do not have any rainfall predicted through the end of July, and August is typically also very dry. This sounds bad but it is tempered by the fact that we had ten inches above average up until May so at least the plants have been given a lifeline to grow big and healthy. But that may not be such a good thing……
Wildfires
Wildfire season is also well underway and with a drought taking hold, all the vigorous growth that occurred in May and June is now crispy and dry. This is a recipe for tragic forest fires to occur when the slightest ignition source escapes into the tinder.
The most common source of wildfire ignition is careless or deliberate acts by our fellow citizens. There were 71, 500 wildfires in the U.S. alone in 2017, and only 10 percent were caused by lightning or lava (yes lava) (according to the Insurance Information Institute, 2018). These fires typically happen near populated areas and can quickly turn tragic in many ways as you can read below.
Loss of life (U.S. Only) – In the 2016 fire season 16 people were killed. In 2017, with only partial numbers available, that number was well above 50 people killed in the US alone. Those numbers will be higher after the official count is released.
Loss of Property – Upwards of 15 billion dollars’ worth of property was lost in the 2017 wildfire season. This accounts for homes and private property as well as infrastructure and agricultural losses. It was the costliest on record.
Environmental Damage – Millions of tons (yes tons) of smoke were produced in the 2017 epidemic of wildfires. Smoke from wildfires has lots of nasty particles, ash and chemicals in it. This is actually very dangerous to human and animal health.
Persistent Smoke – I have lived in the Pacific Northwest for 40 years and I cannot remember a summer where persistent, thick smoke and falling ash were present for weeks at a time like they were during the summer of 2017. We experienced it here, even though many of the fires producing the smoke were hundreds of miles away.
2018 could be similar to previous years – The peak of wildfire season is in September, but we are already seeing large wildfires in California, Colorado and other western states.
Forecast for Late Summer and Fall
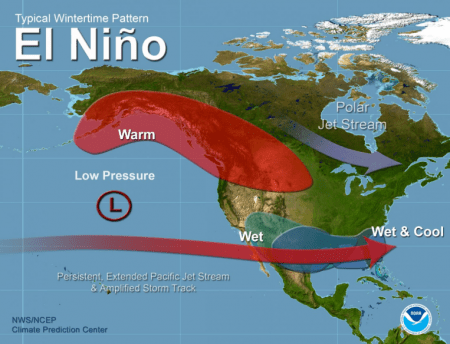
The National Weather Service (NWS) has issued an El Niño watch for the fall and winter months of 2018 – 2019.
If you recall, an El Niño typically means a little drier and a little warmer in the winter months for Western Washington; whereas the opposite pattern, La Niña, is generally associated with cooler and wetter winter weather.
It is the general consensus, however, that these particular patterns may not correlate as well as once thought for the Pacific Northwest. In discussions with some scientists with the National Weather Service in Seattle, the direct correlation is not that strong so they are beginning to lessen the reliance on this pattern as a predictor of wet season weather.
I tend to agree with the NWS assessment based on Thurston County’s own 20-year data collection and analysis program. So, keep this in perspective if you read about an El Niño watch published in the newspapers. It may or may not be as significant as it is portrayed in the media.
Below is a graphic from the National Weather Service illustrating the typical pattern that El Nino can bring to the PNW winter. El Nino is the predicted for the fall and winter of 2018-19.


